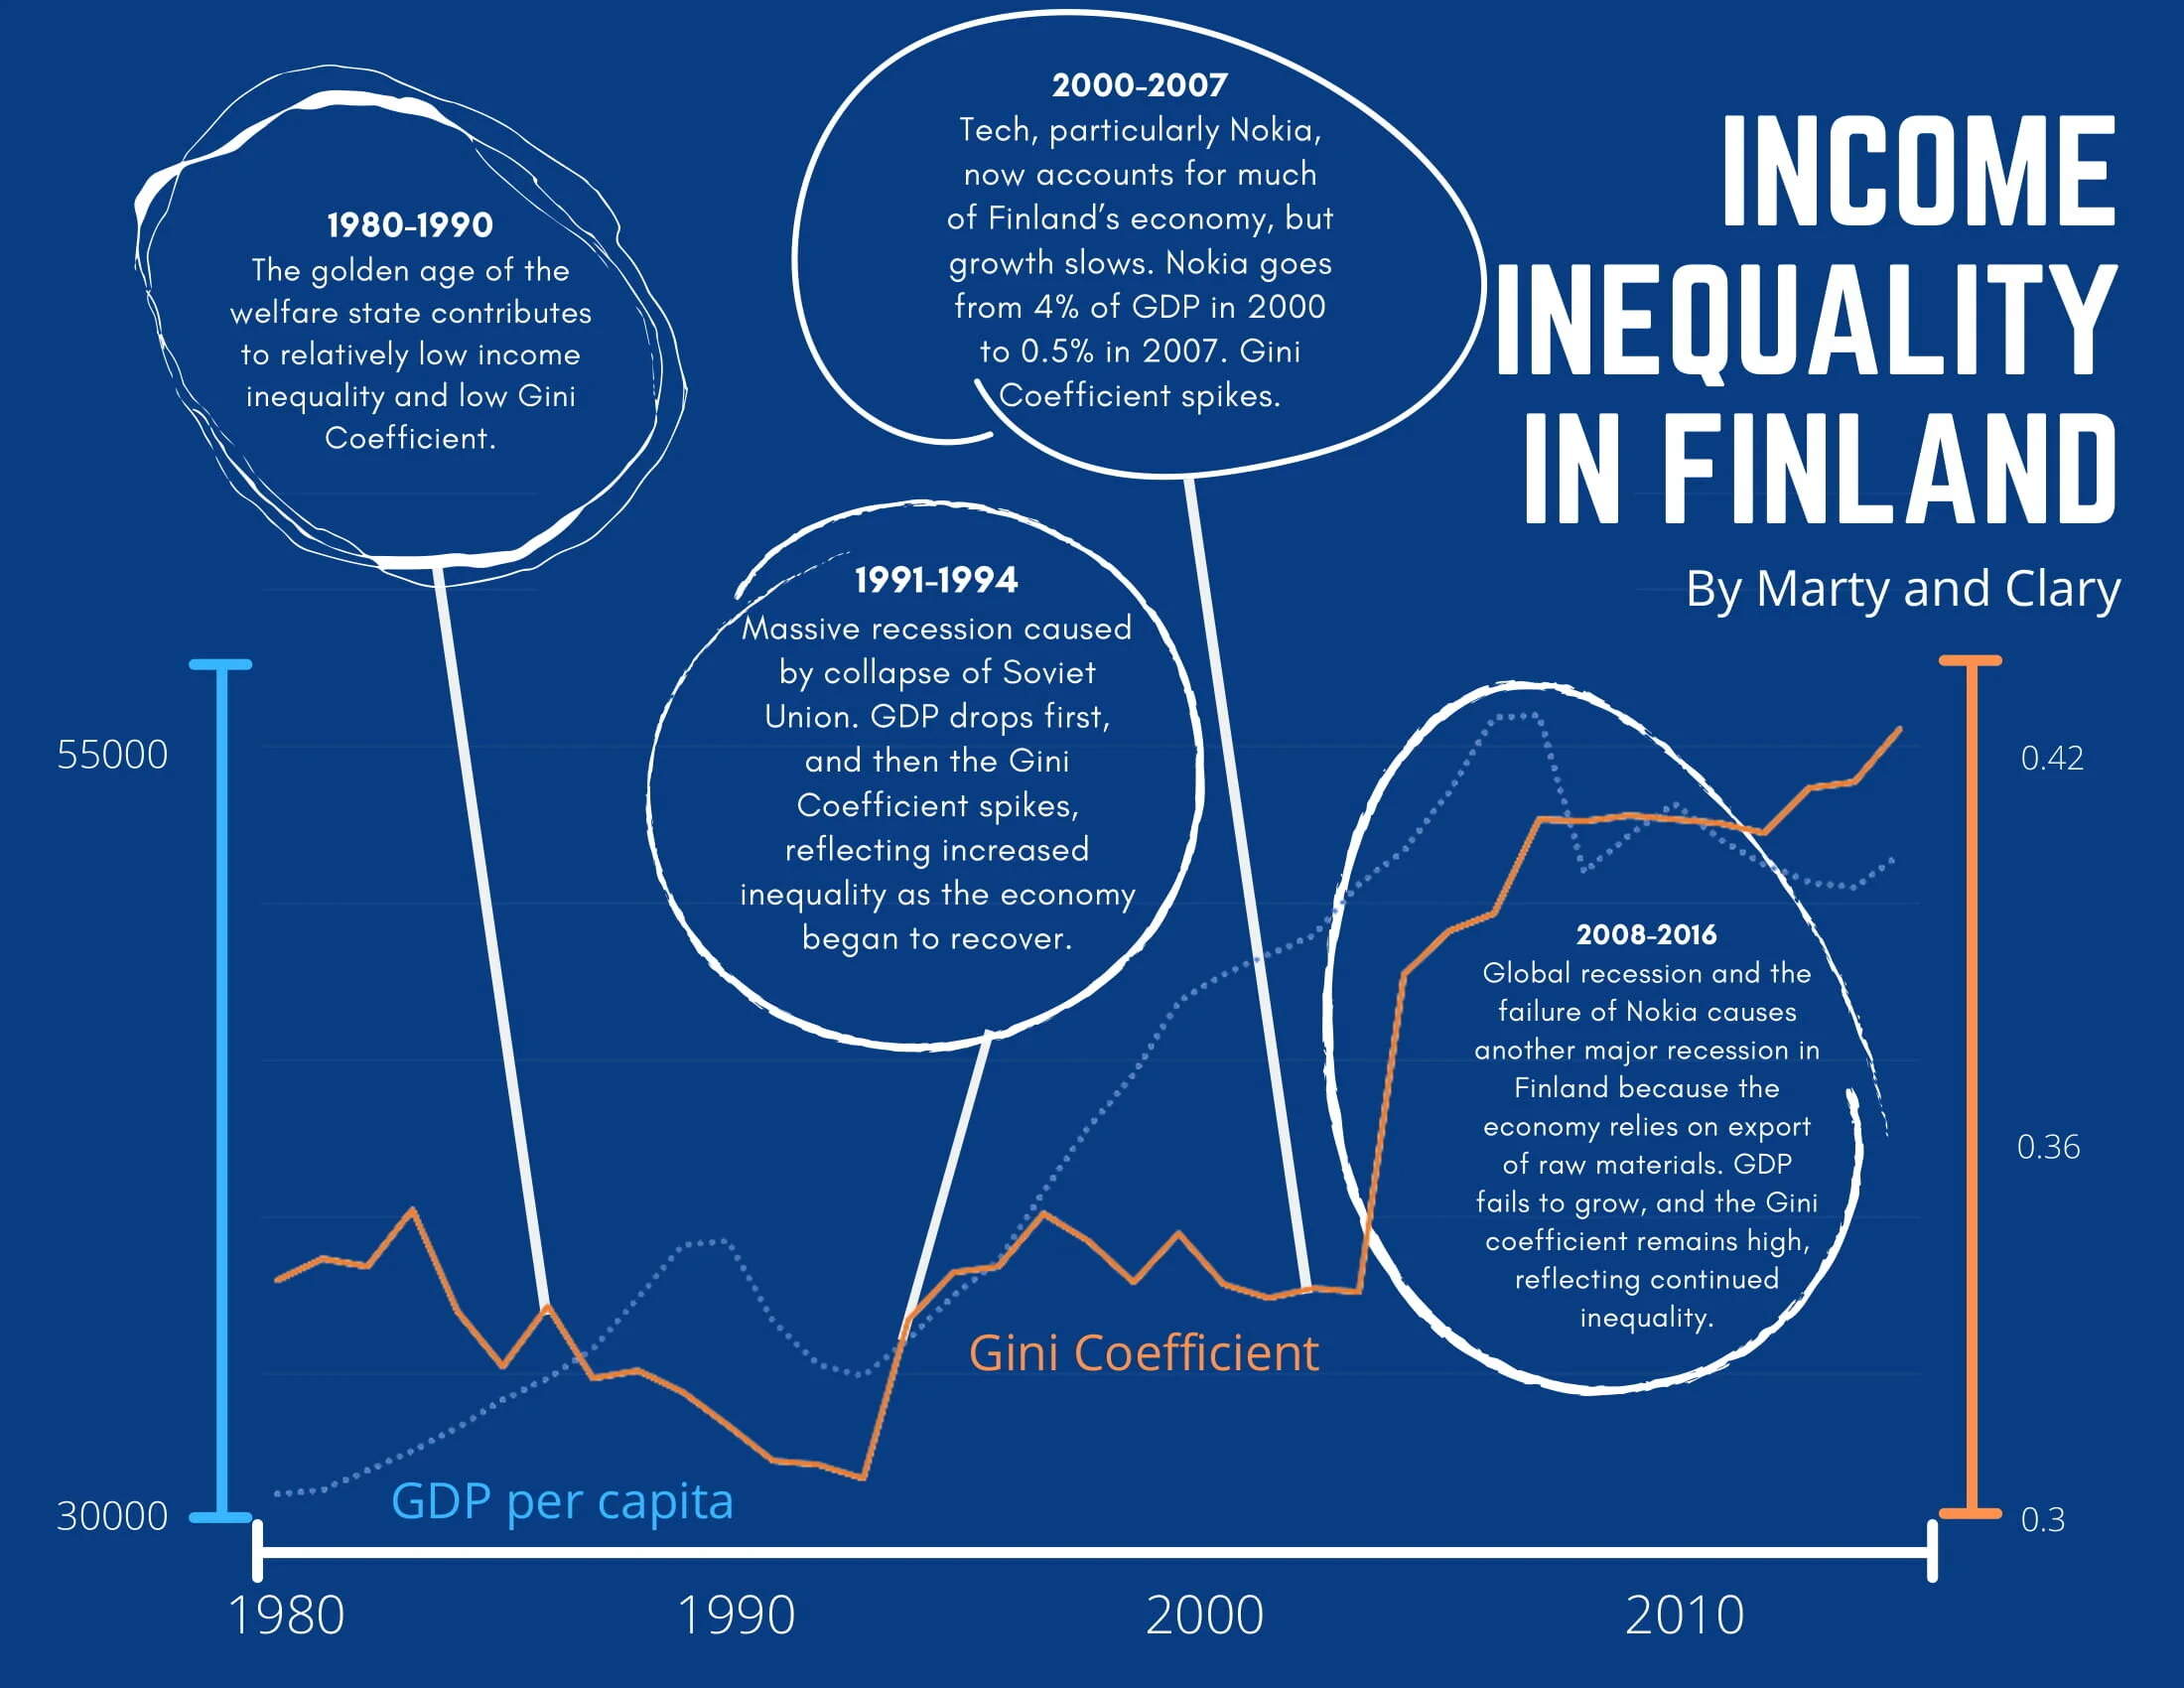
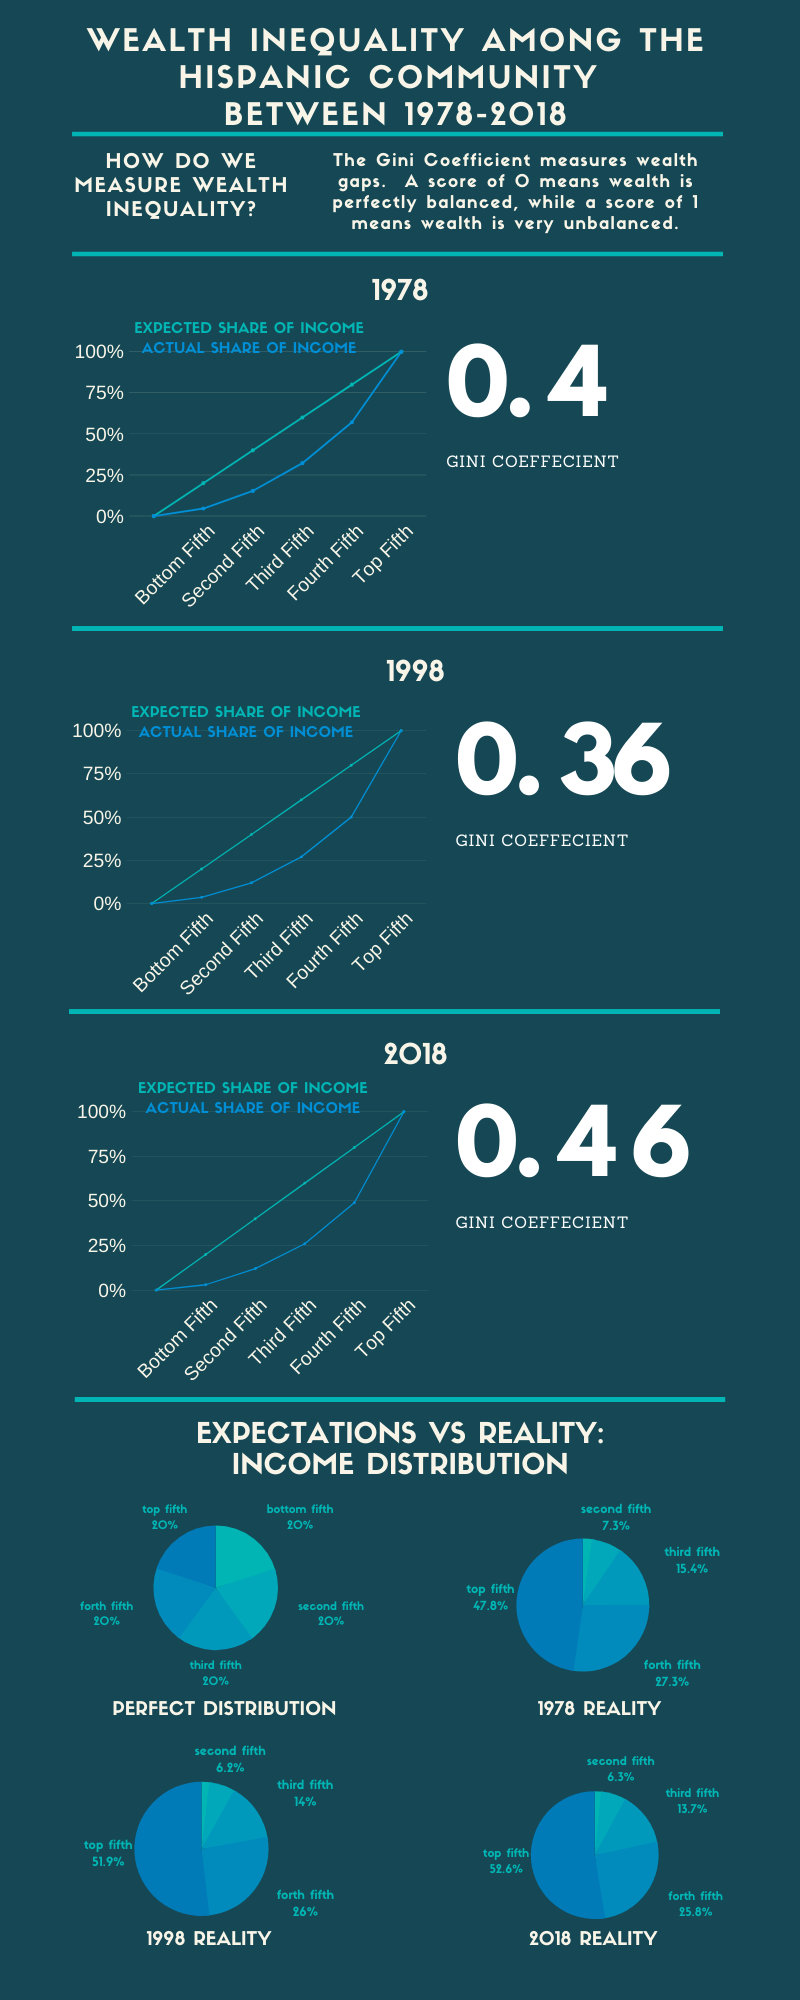
Gini Coefficient Infographics


The Gini Coefficient is a measure of income inequality which considers how much of a population’s total income is controlled by each fifth of the population. Income which is distributed equally to each fifth would lead to a Gini Coefficient of 0; in the United States in 2018, the Gini Coefficient for working adults was 0.49. This means that total income in this country was distributed much more to the highest earners than to the lower earners.
Using this knowledge, students worked in groups to chose several distinct populations. Students then sourced data in order to find the Gini Coefficient for each population, using their knowledge of curve fitting and integration to do so. Finally, each group compiled their findings into an infographic.
Click on the images to see each group’s work in detail! Be sure to leave any comments or questions.


