Division 4 MST Applies Calculus to Model Infection Rates
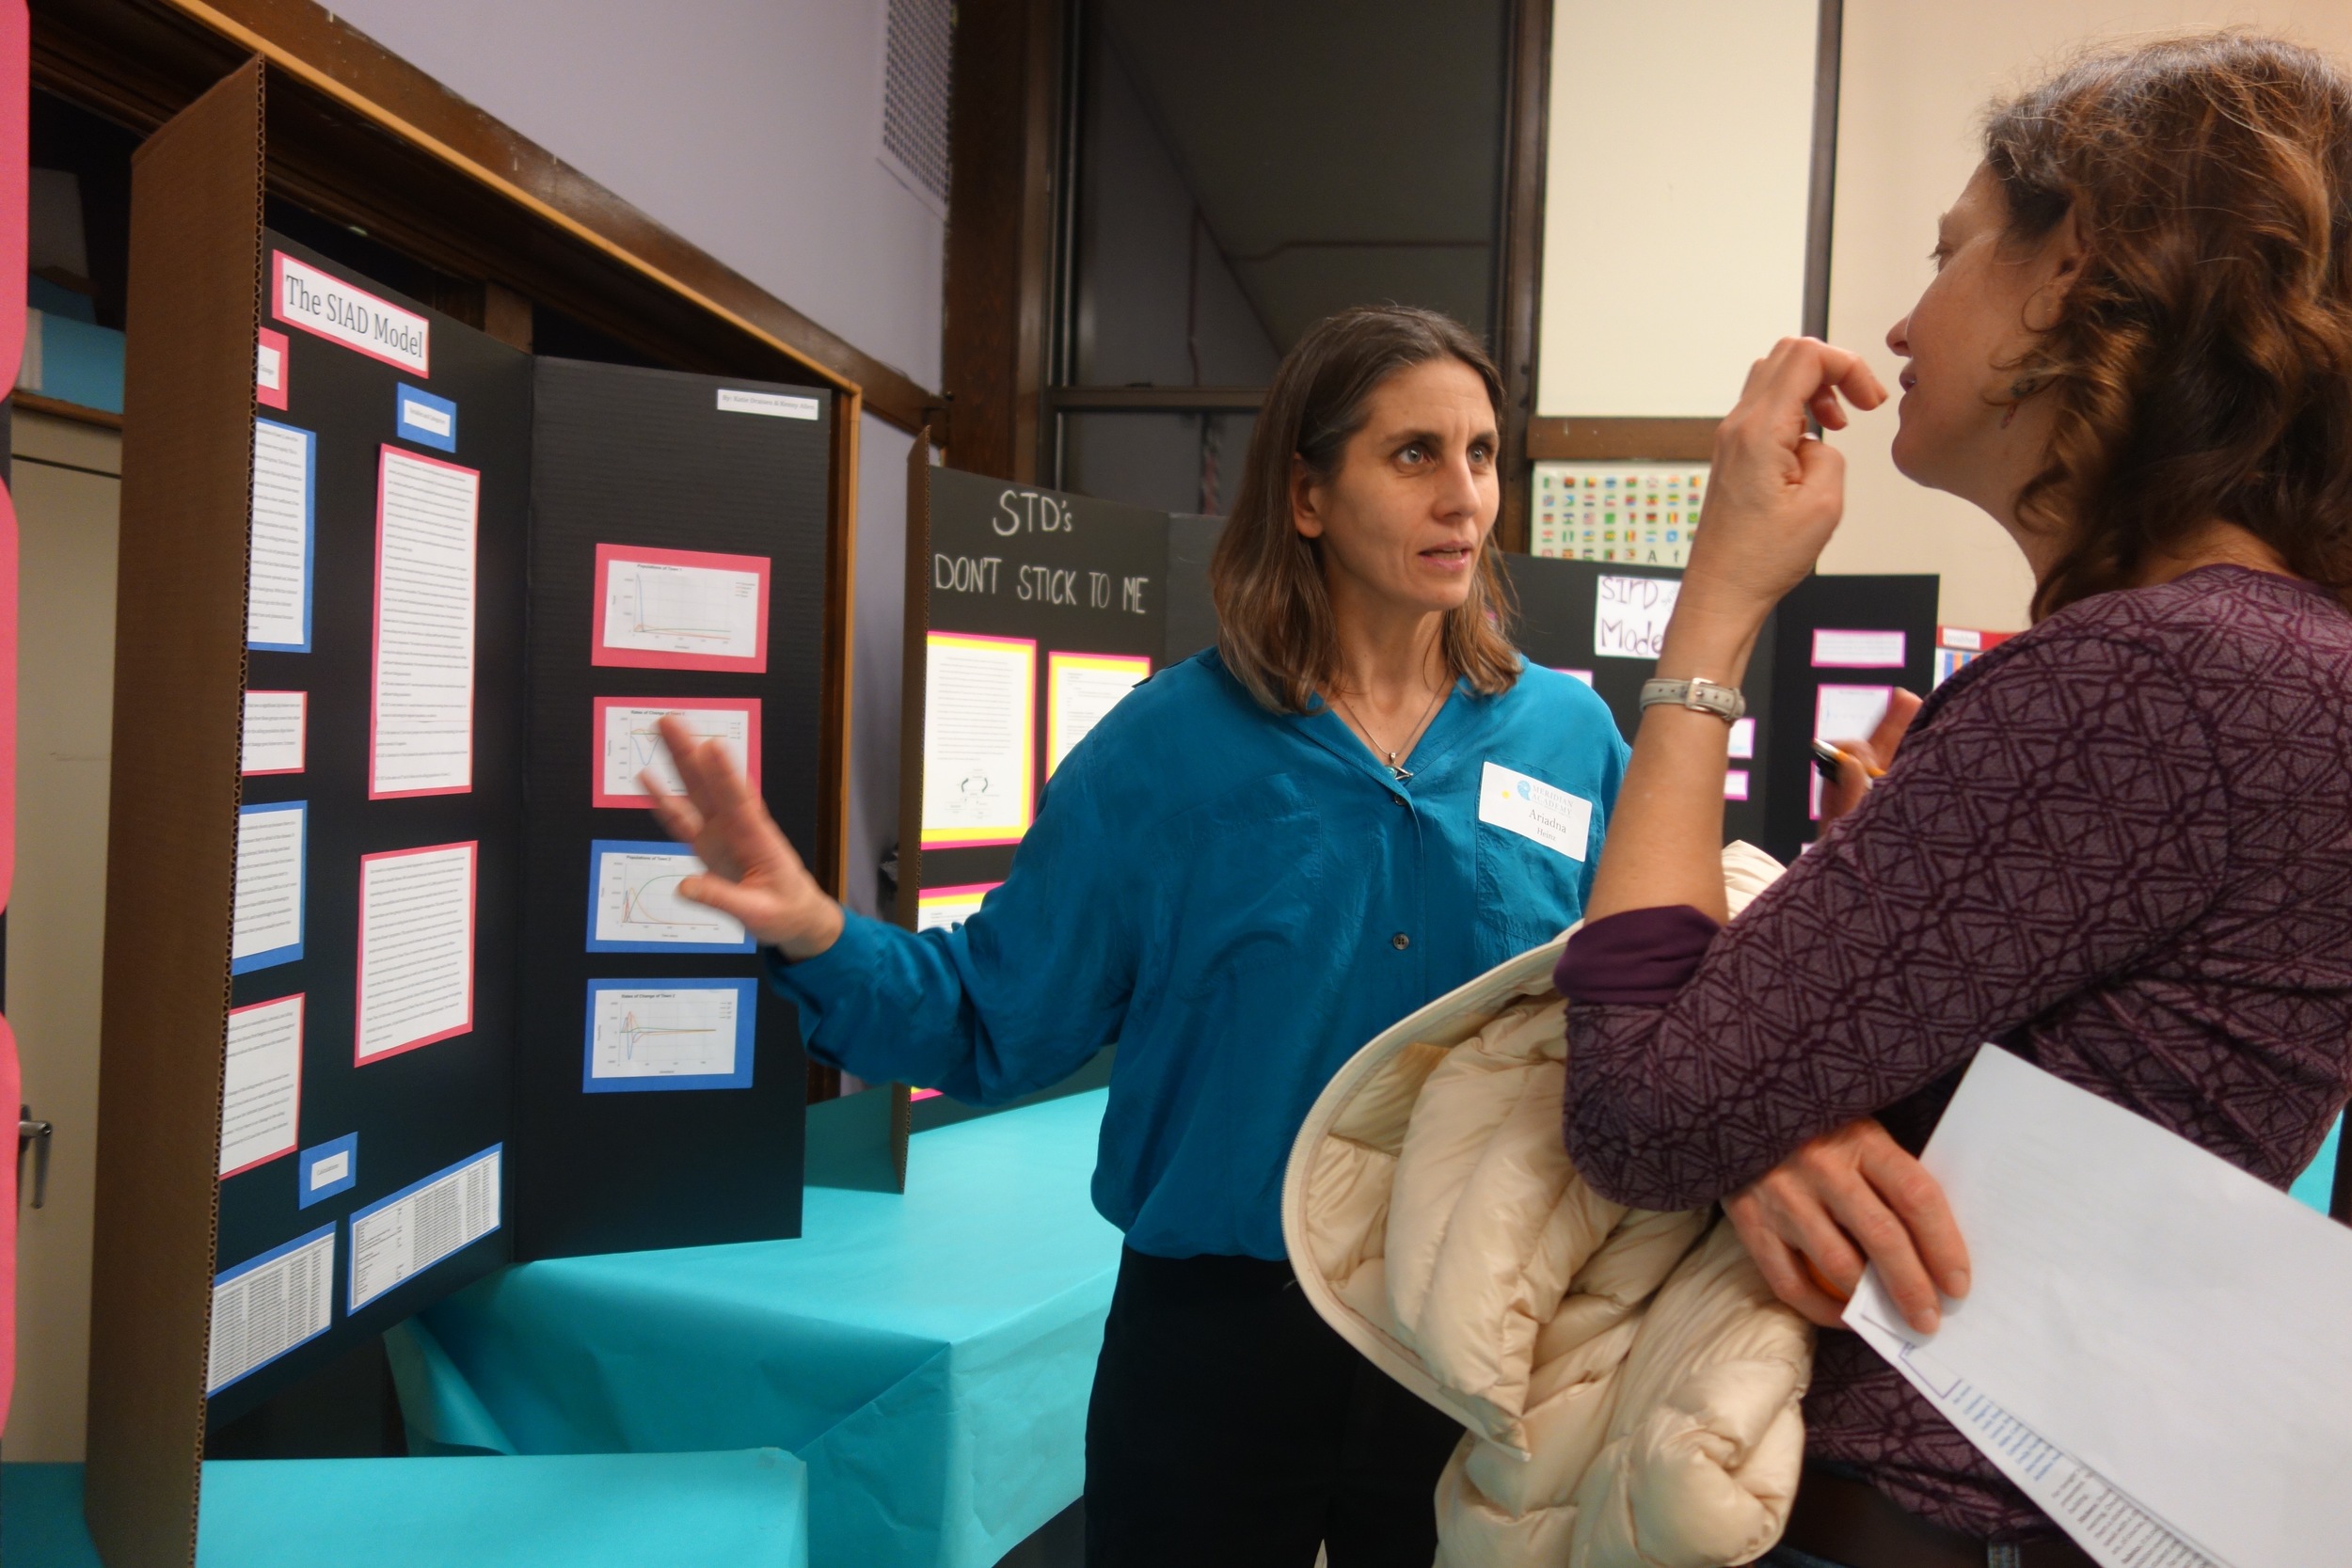
In any learning environment, students rightfully wonder, “How does what we’re doing relate to the real world?” Meridian teachers strive to make learning relevant, and this fall, students in Ariadna Heinz’s Division 4 MST class grappled with a question that is both valuable and timely: How can we model rates of viral infection, and how will we know when and how many people will become infected?
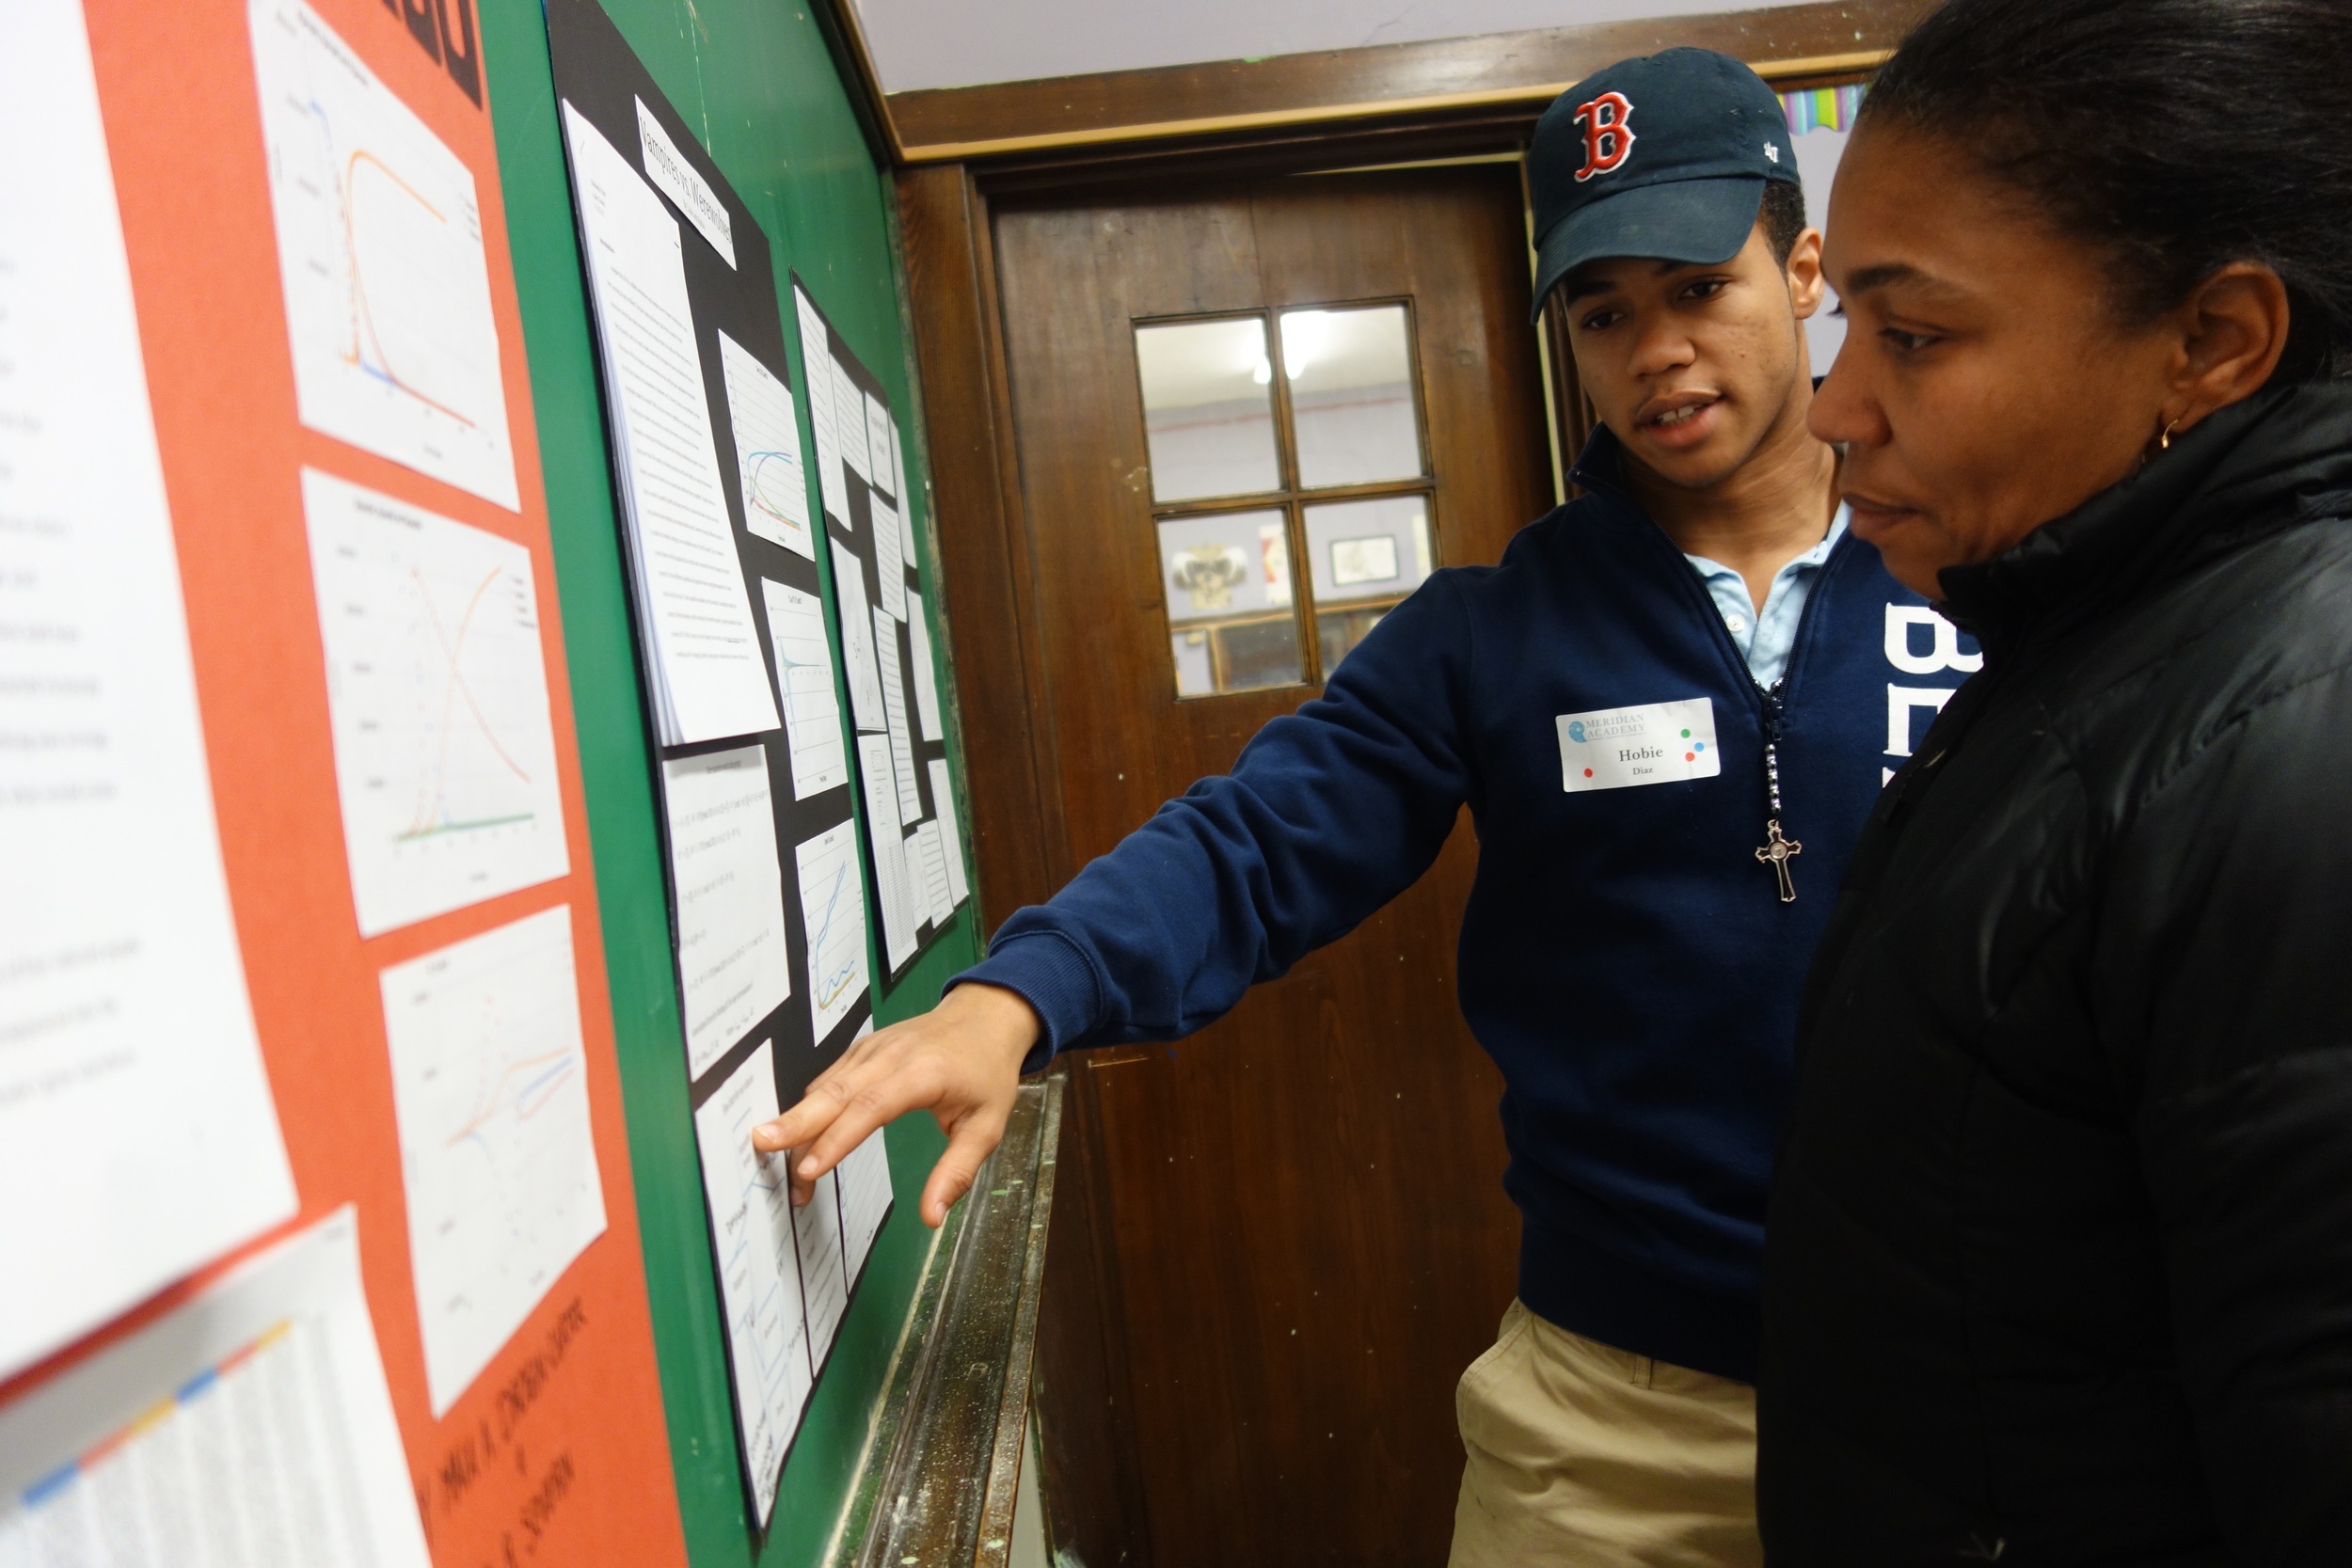
To answer this question, students in our “Calculus, Physics, and Modeling” course developed equations that predict Susceptible, Infected, and Recovered populations, commonly called a SIR model. “Infected” people currently have the virus, “susceptible” people are not yet infected but could be, and “recovered” people have already been infected. What makes the project especially meaningful is its relevance to the real world; researchers depend on SIR models to understand viruses like Ebola. After an outbreak begins, they keep track of the populations over several days and then start preparing the community depending on how the model plays out.
To identify the size of each population — and how that quantity could change over time — students needed to use differential equations, or equations that represent rates and include interdependent variables. For instance, how the infected population will change depends directly on the number of people who are currently susceptible.
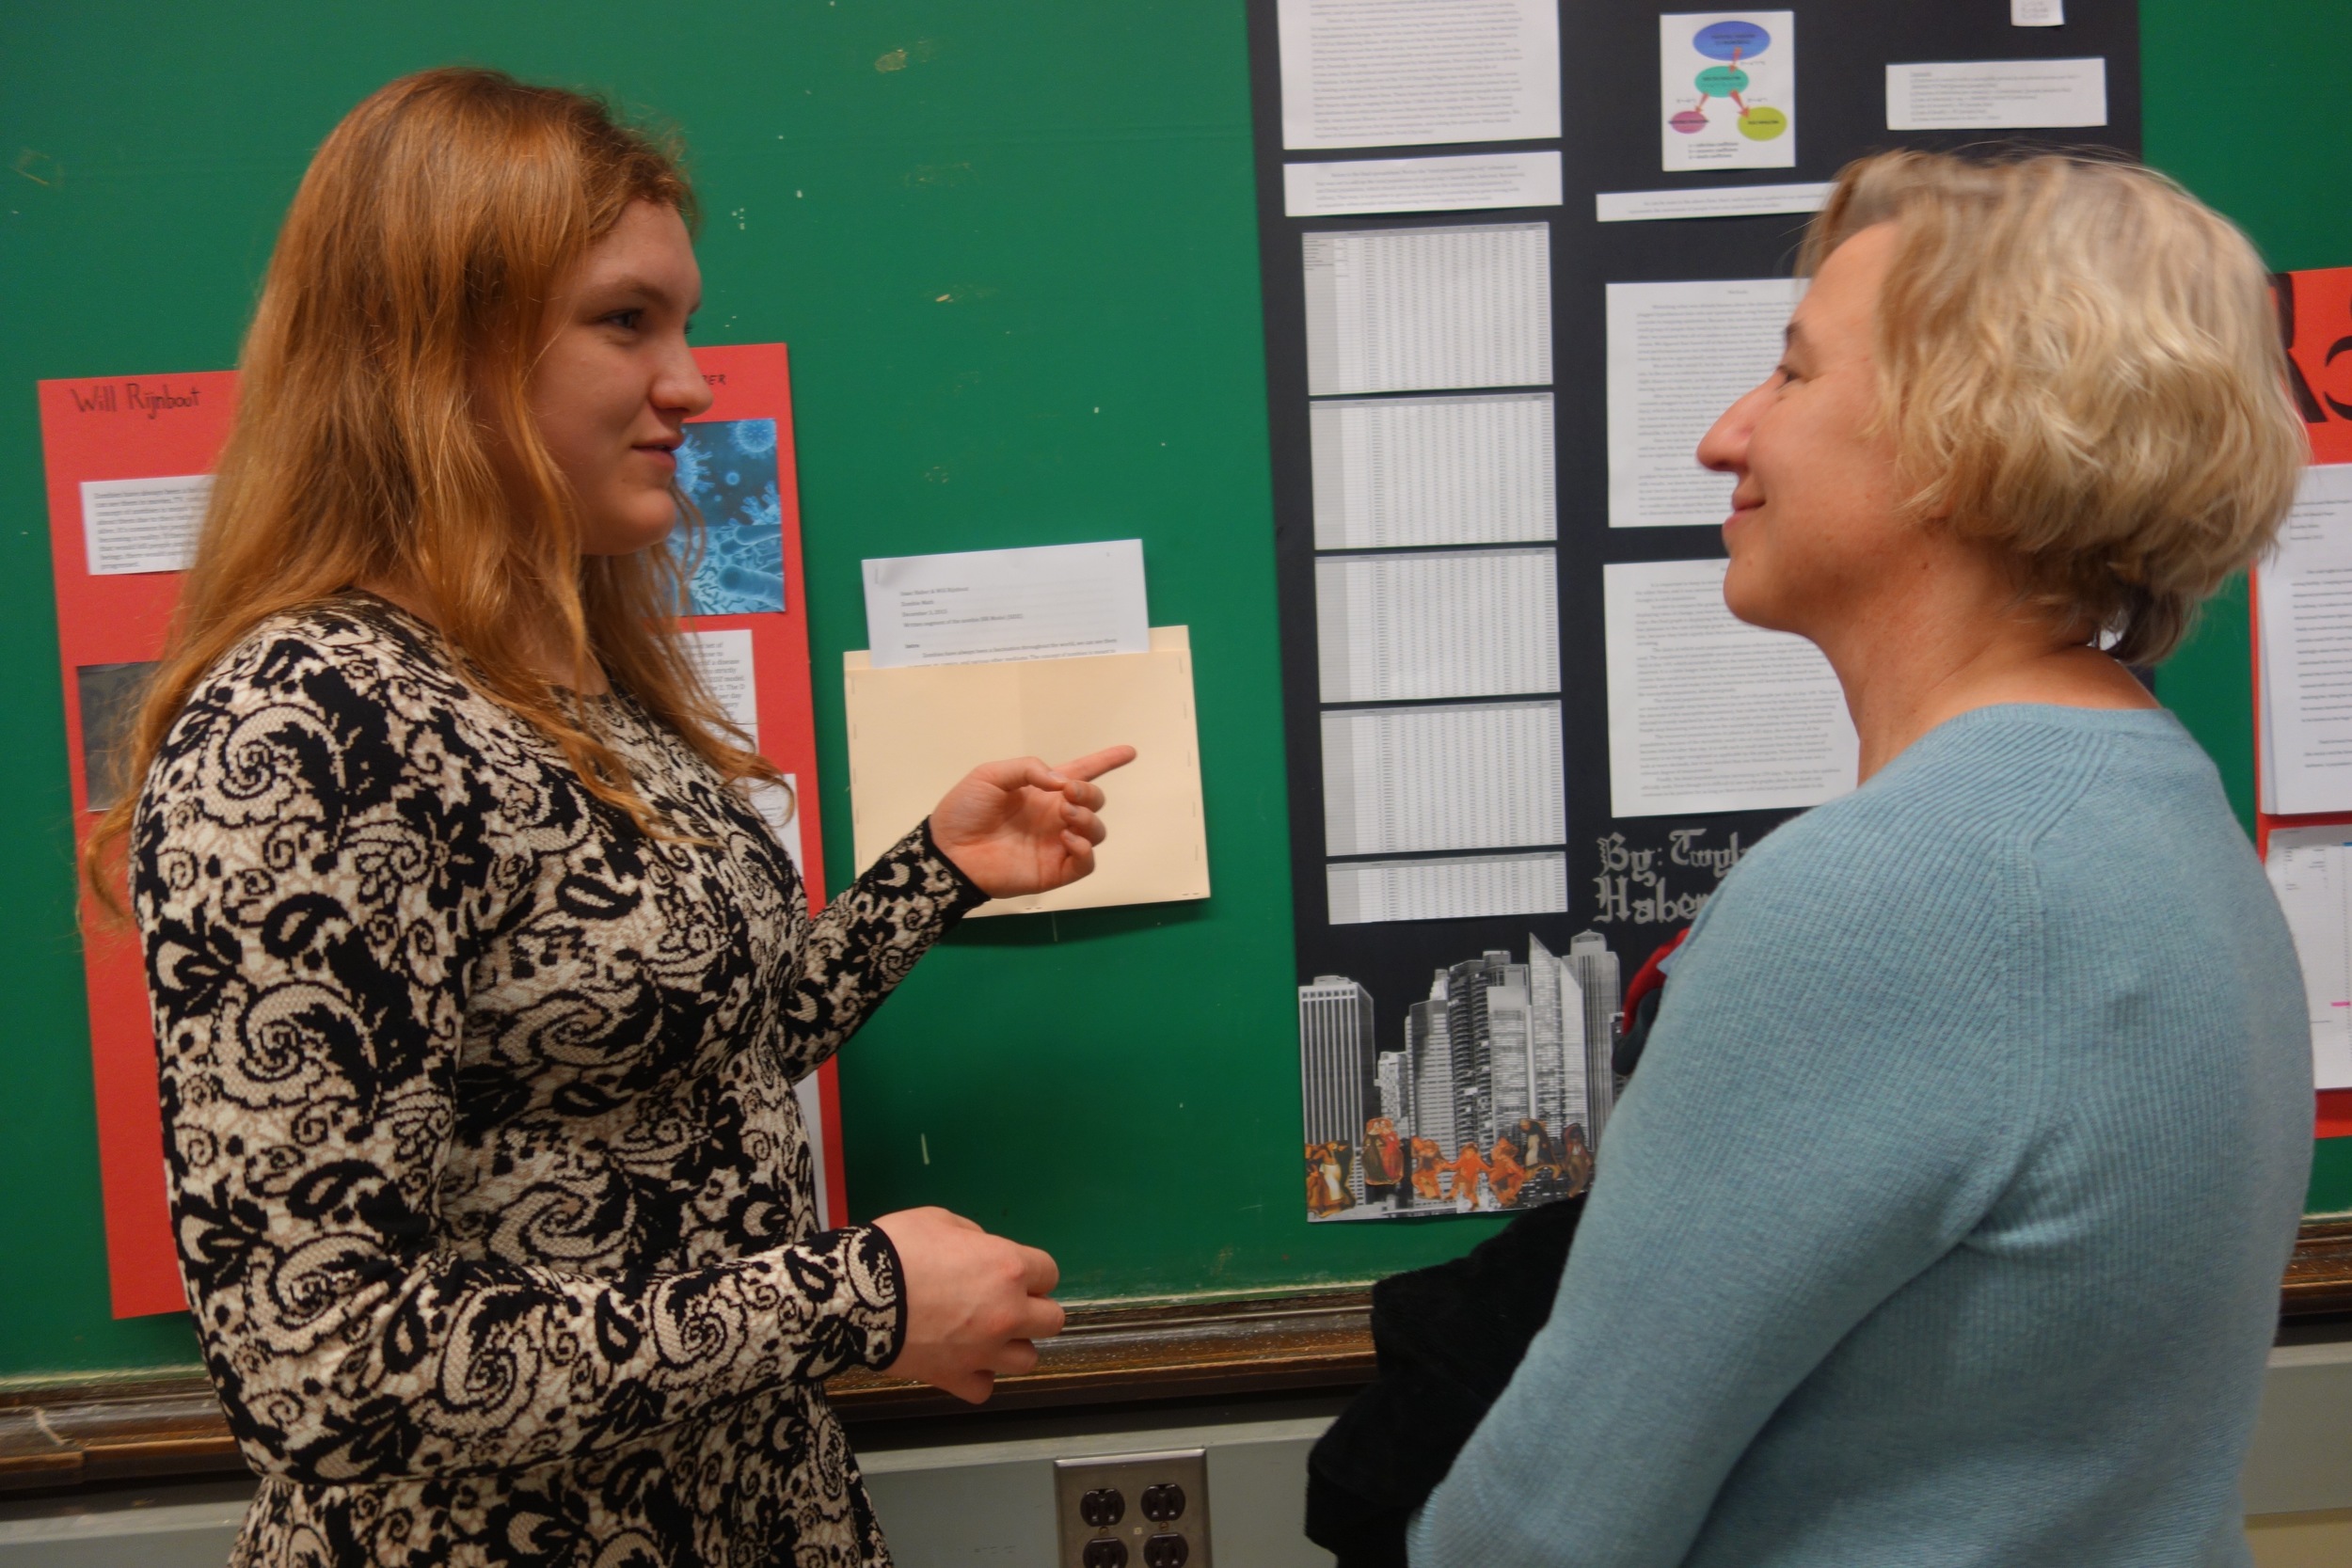
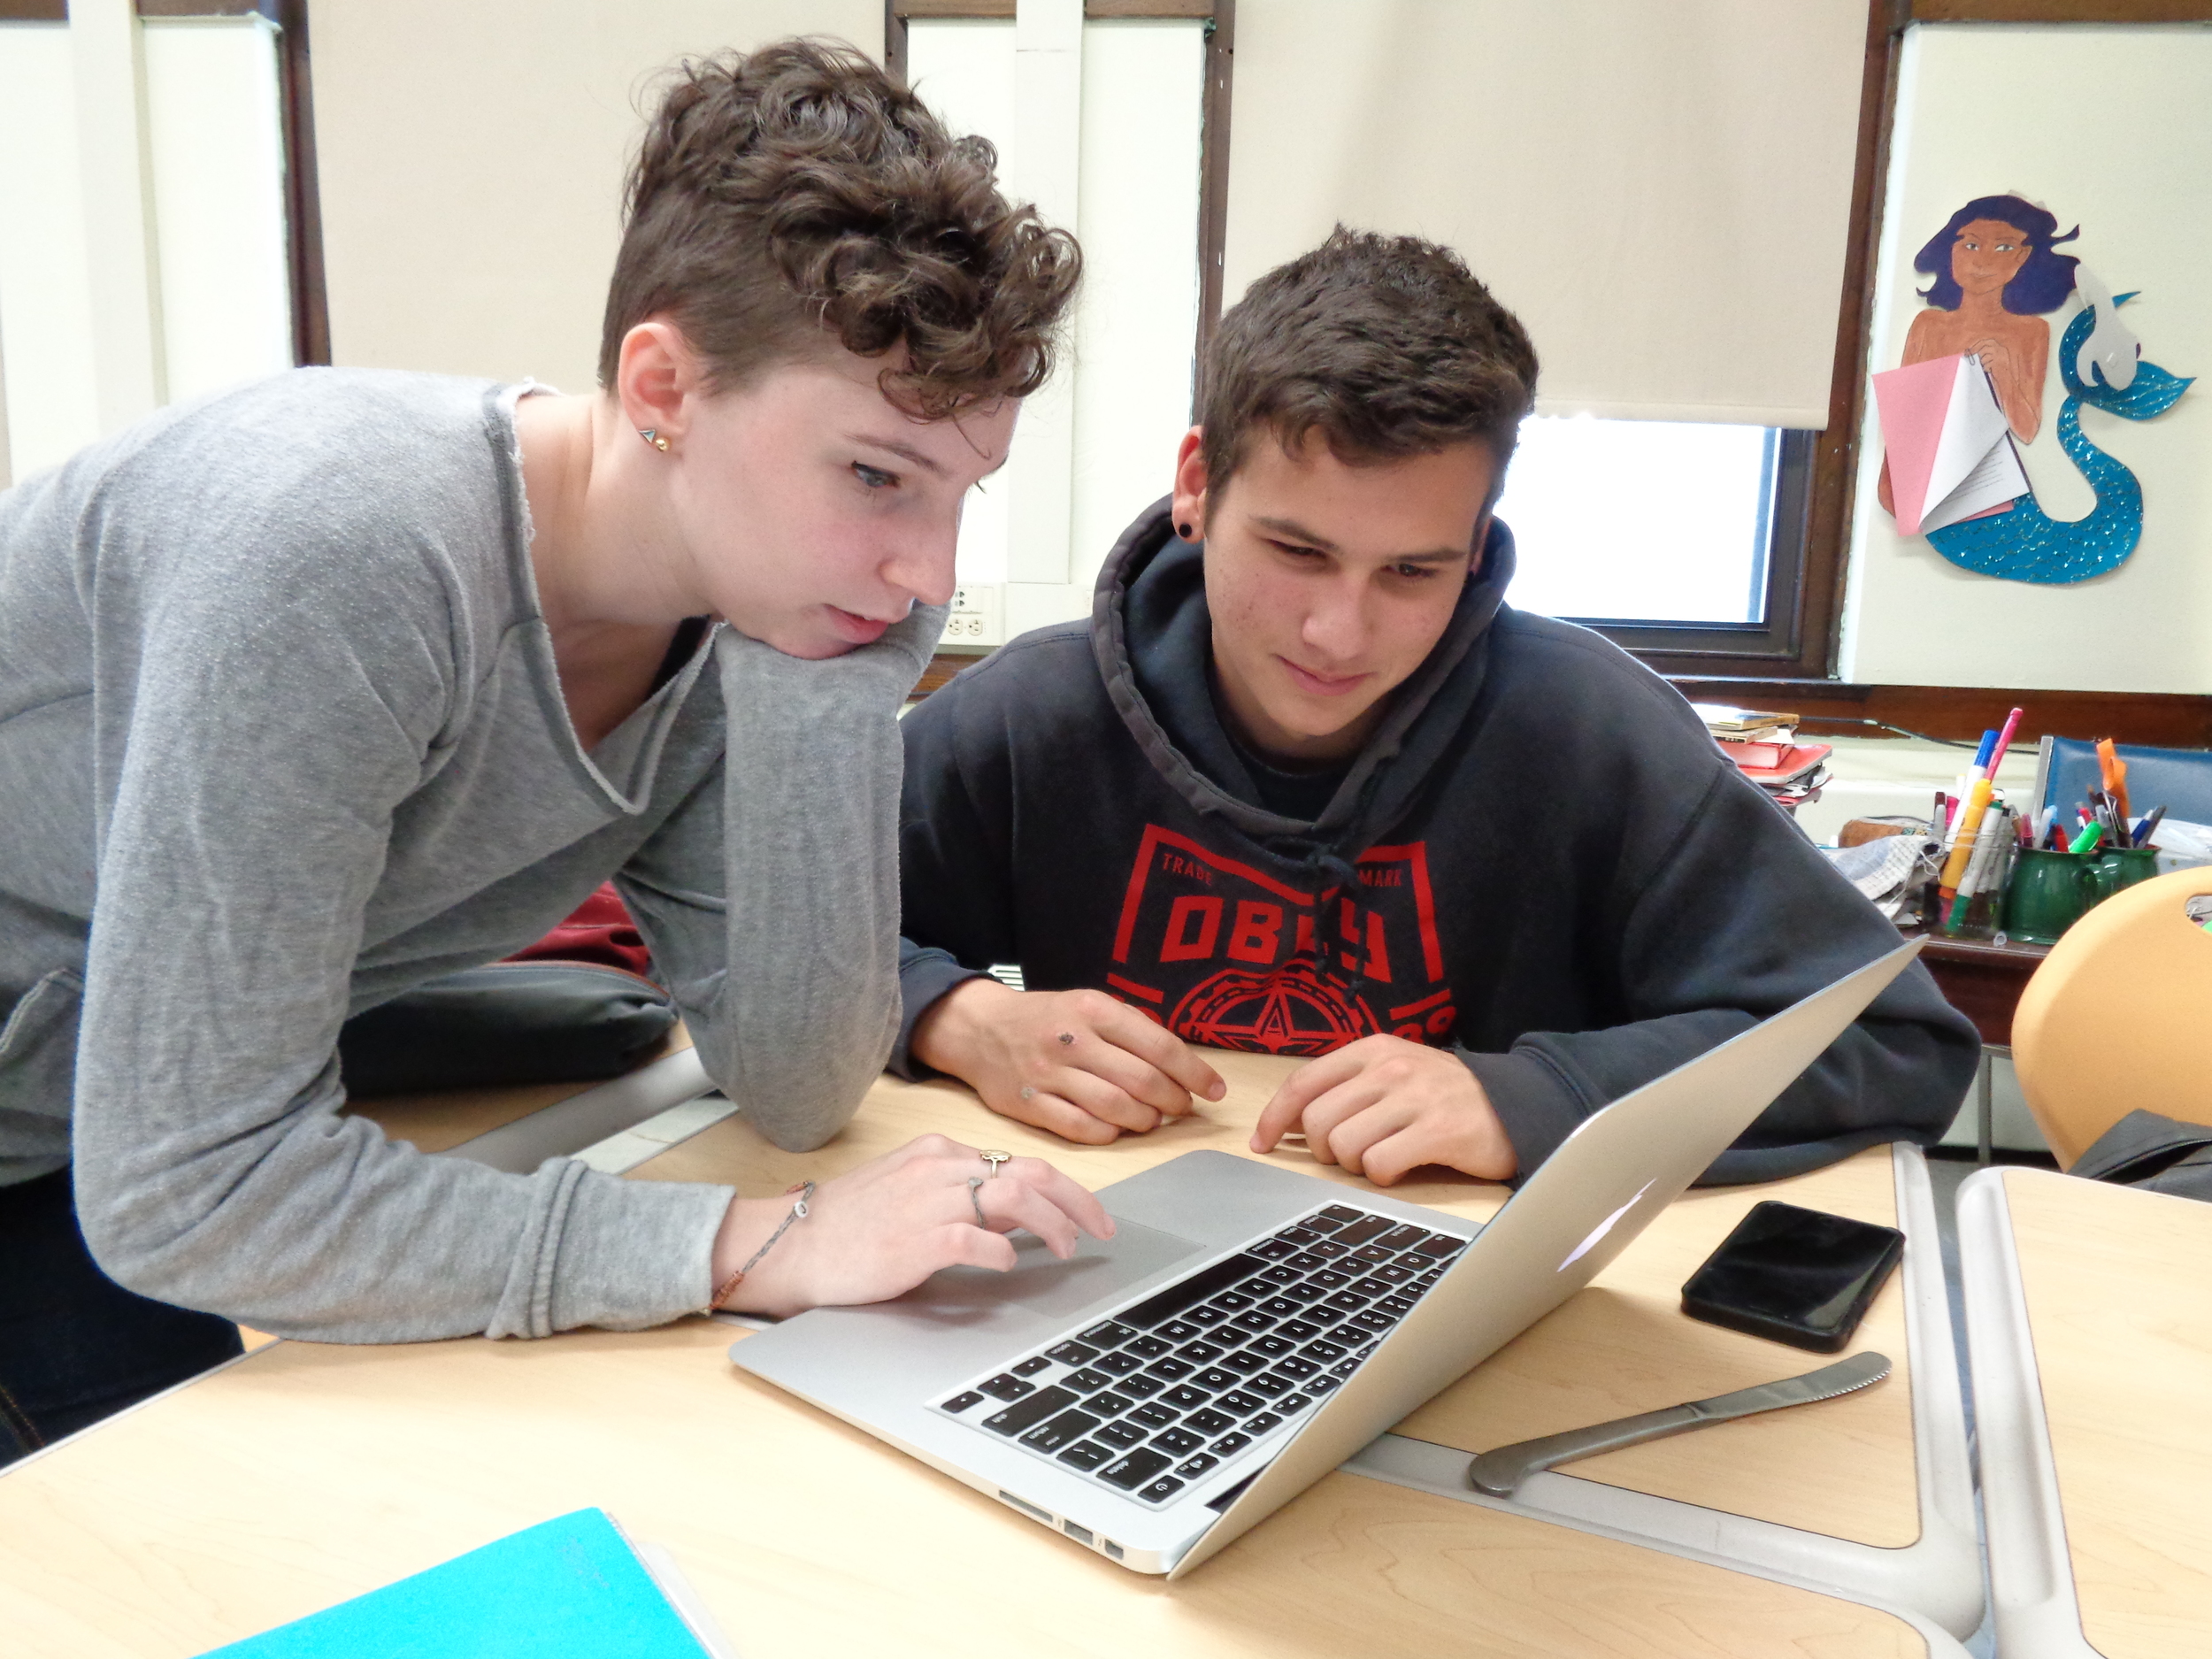
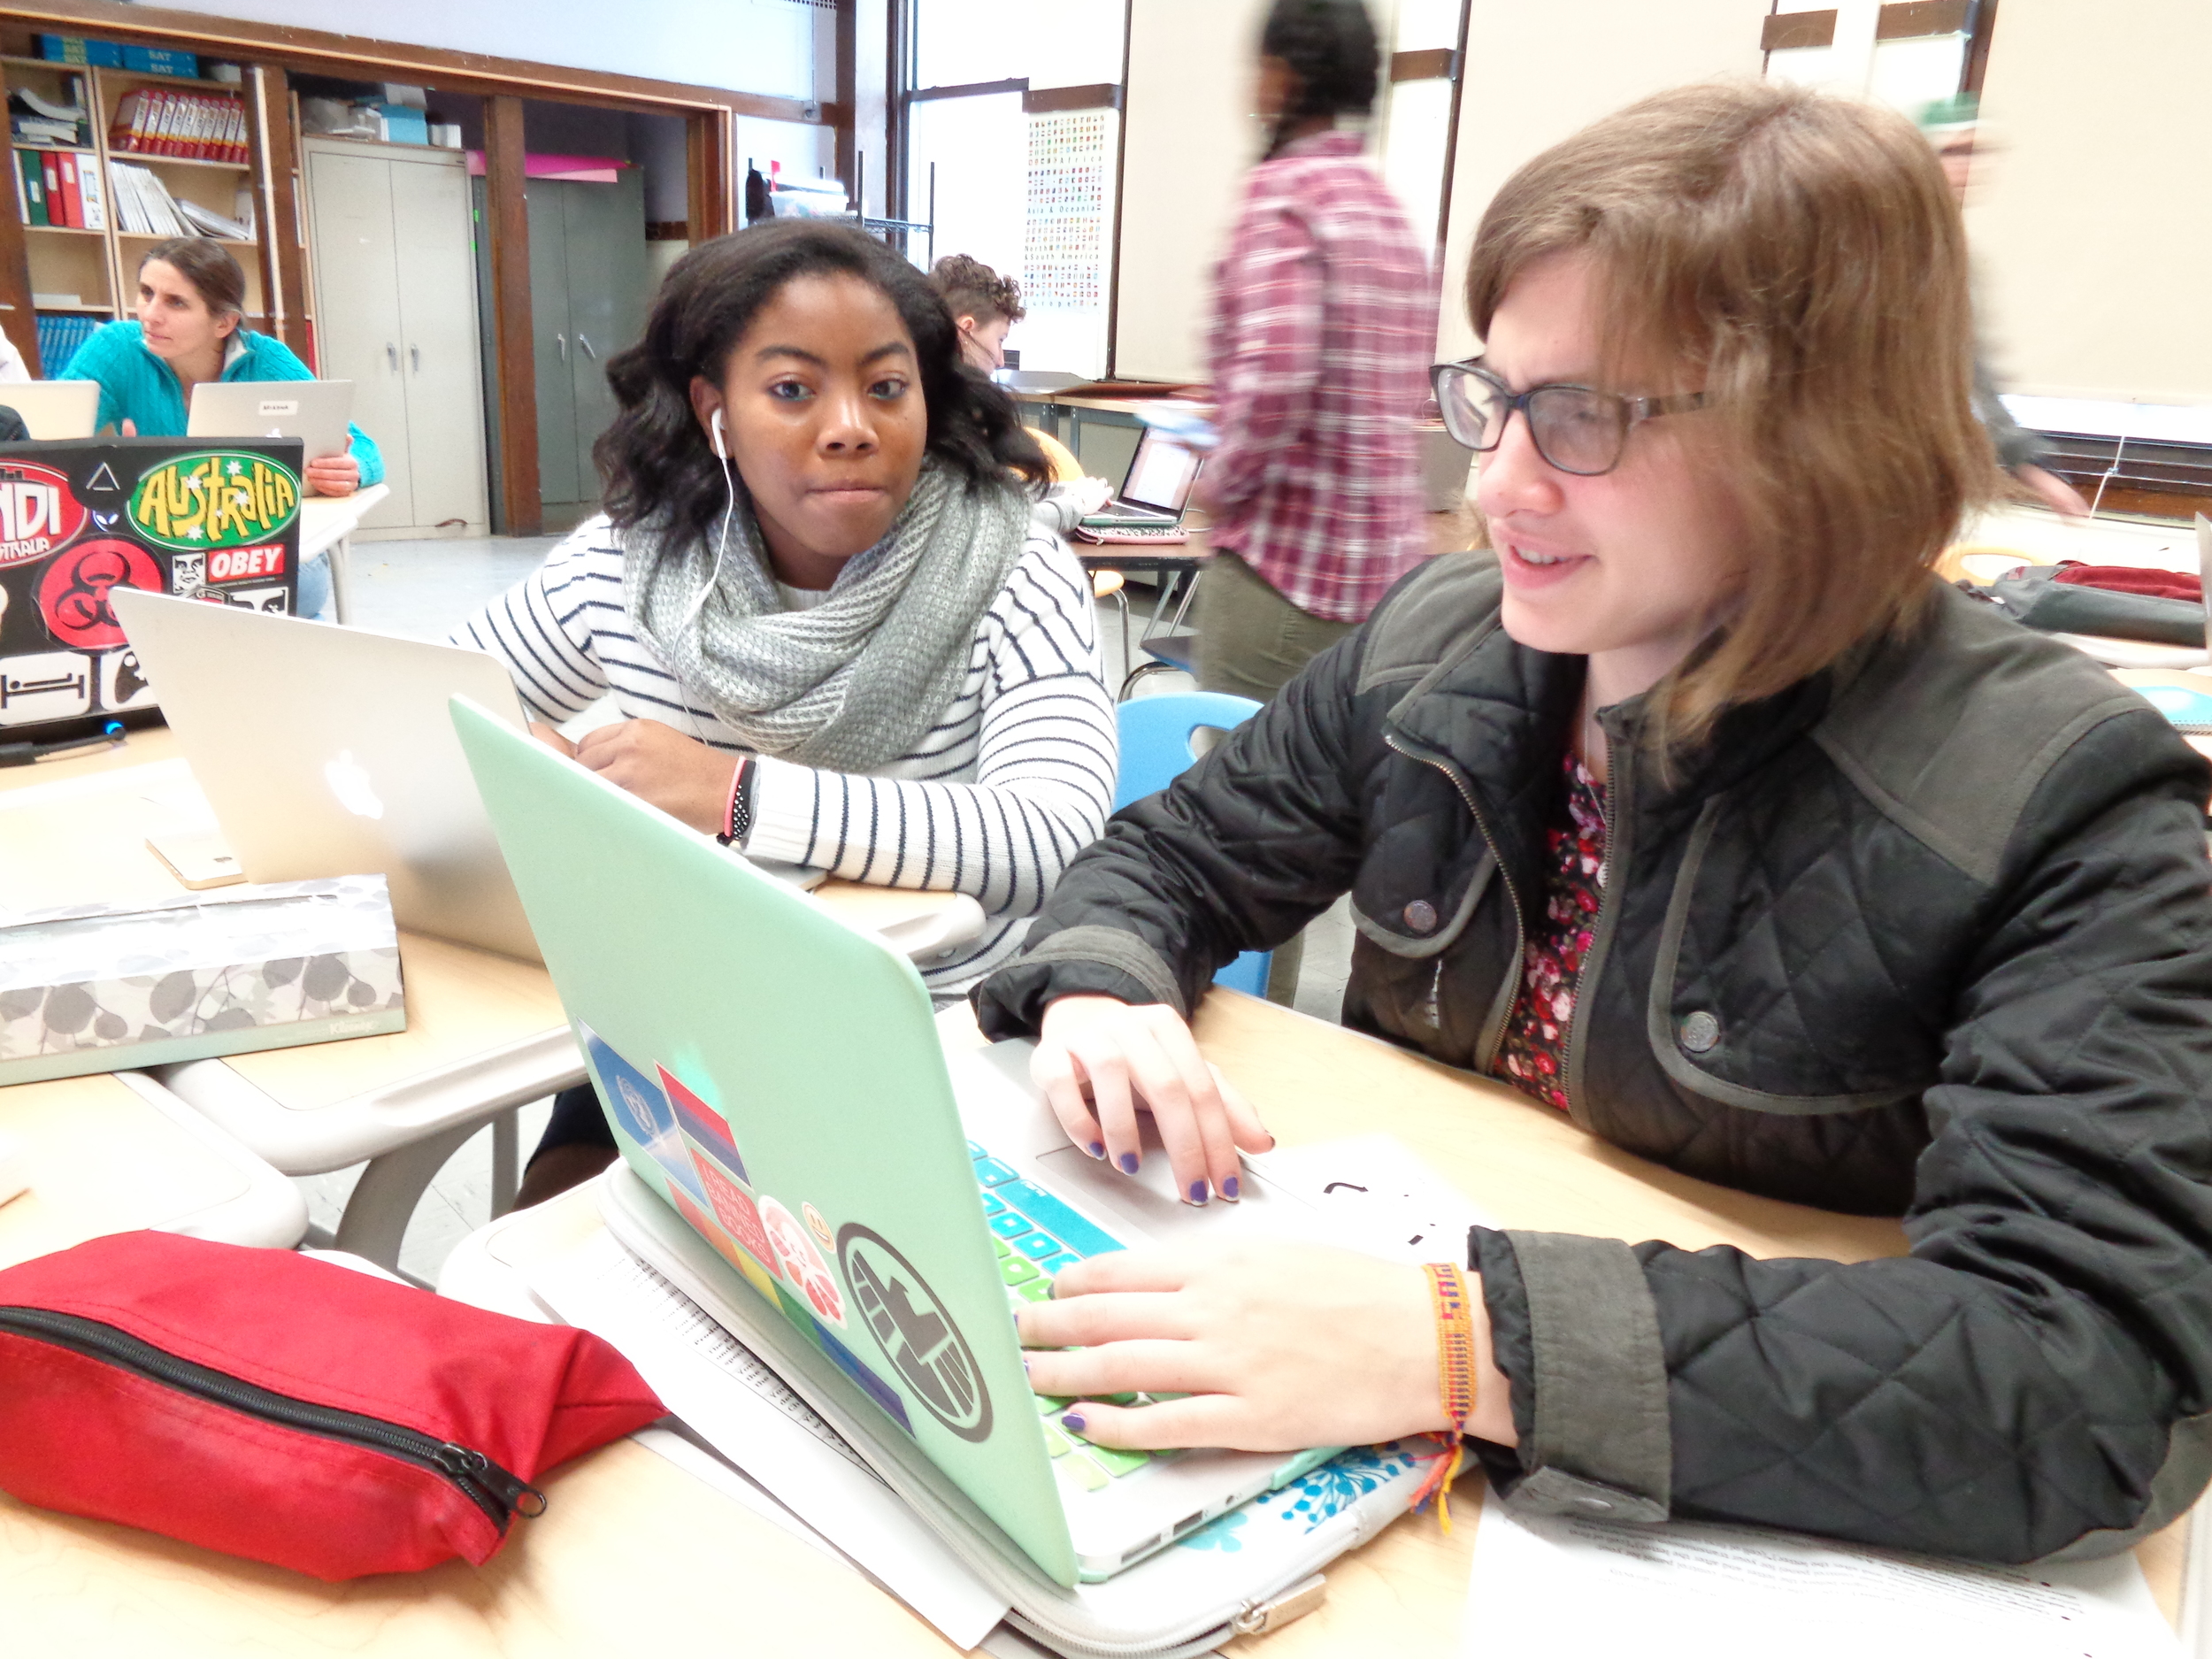
Students had to create their own models of new settings that built upon what they learned from the standard SIR equations. In one group, junior Twyla and senior Haben decided to model the “Dancing Plague,” an epidemic that occurred in Strasbourg in 1518, in which the afflicted danced uncontrollably for hours or sometimes days. Twyla said that modeling a disease that actually happened — as opposed to an imaginary infection, like zombies — made their project both easier and harder. The Dancing Plague “was very poorly documented,” Twyla explained. “We had to create equations and then see how well they matched the results we were supposed to get, and then figure out where we went wrong when it wasn't what we wanted it to be.” Twyla and Haben also decided to scale their findings to a contemporary city: “Scaling our numbers up from 1518 Strasbourg to modern New York City was interesting,” said Twyla, “because it showed us where in our equations we couldn't support larger numbers.”
"The word I’d use to describe this project is ‘dynamic,’” said Ariadna, citing the complexity of working with differential equations. “It's really tough, but really satisfying."

